Security Suite
Toshiba ELERA® introduced Security Suite, a software solution that uses data from POSPoint of sale hardware to address retail shrinkLoss of inventory due to theft or error and improve self-checkout experiences through AI insights.
IMPACT
243 locations
Stores Adopted
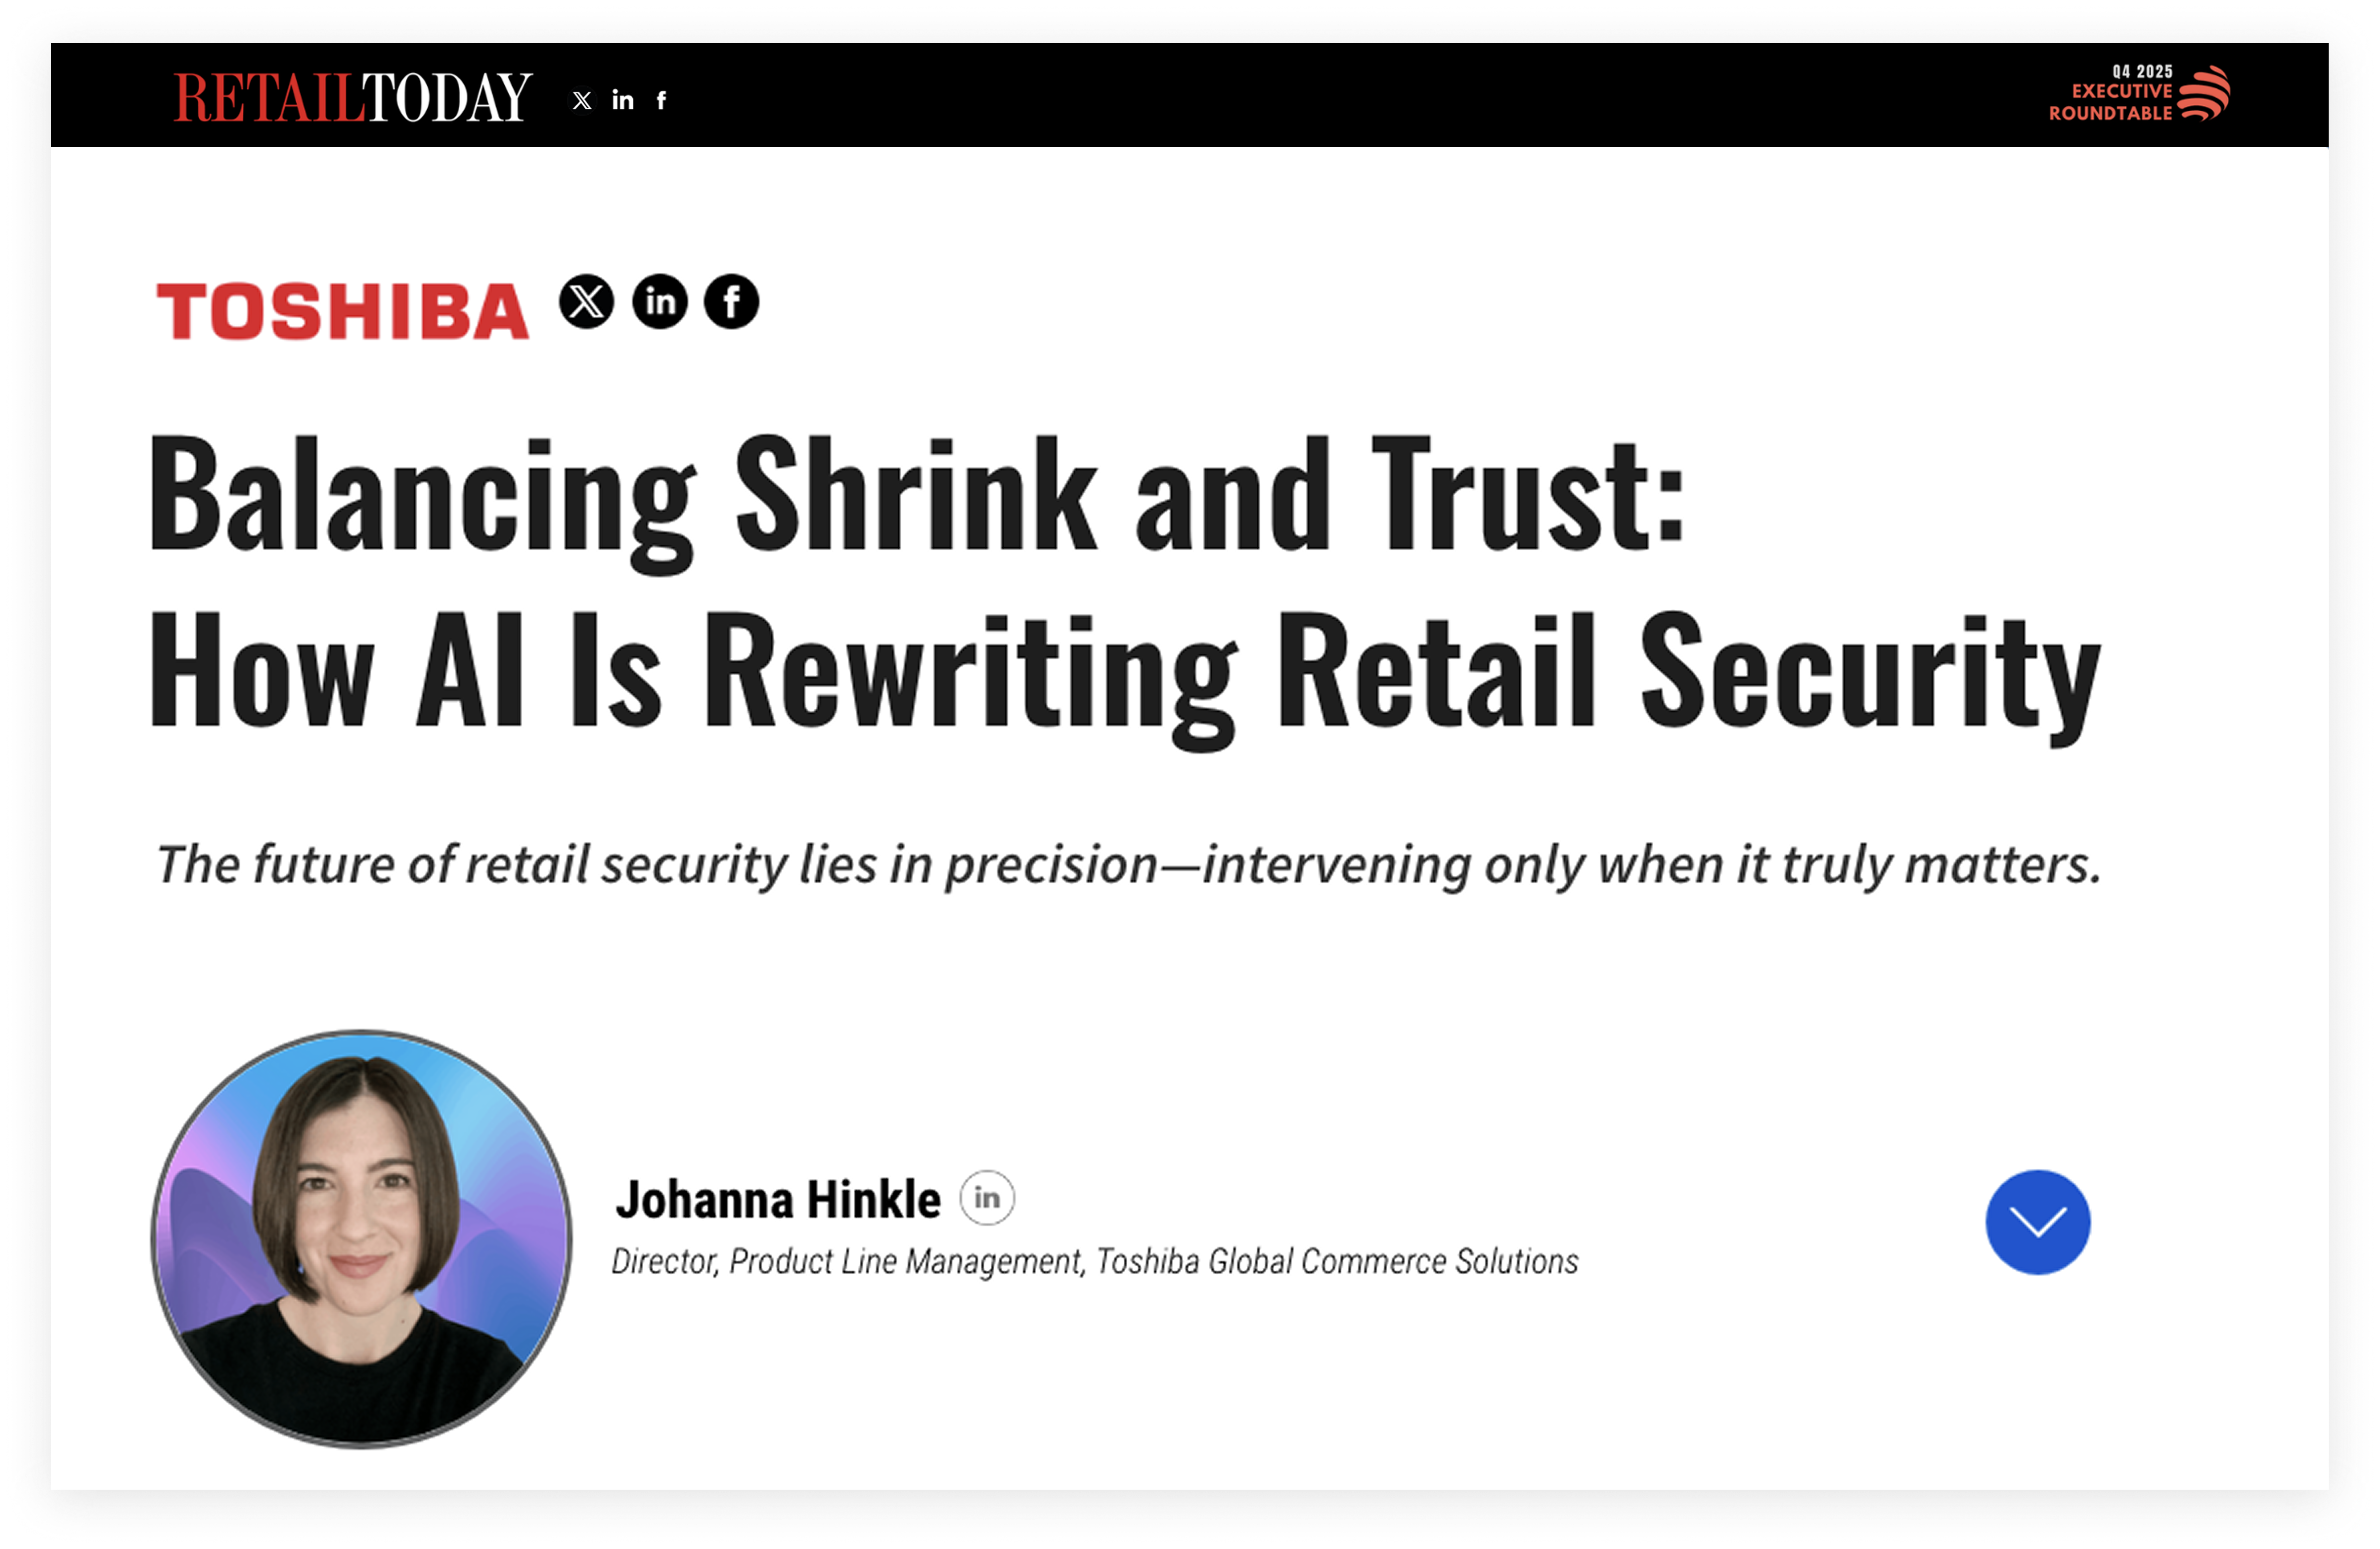
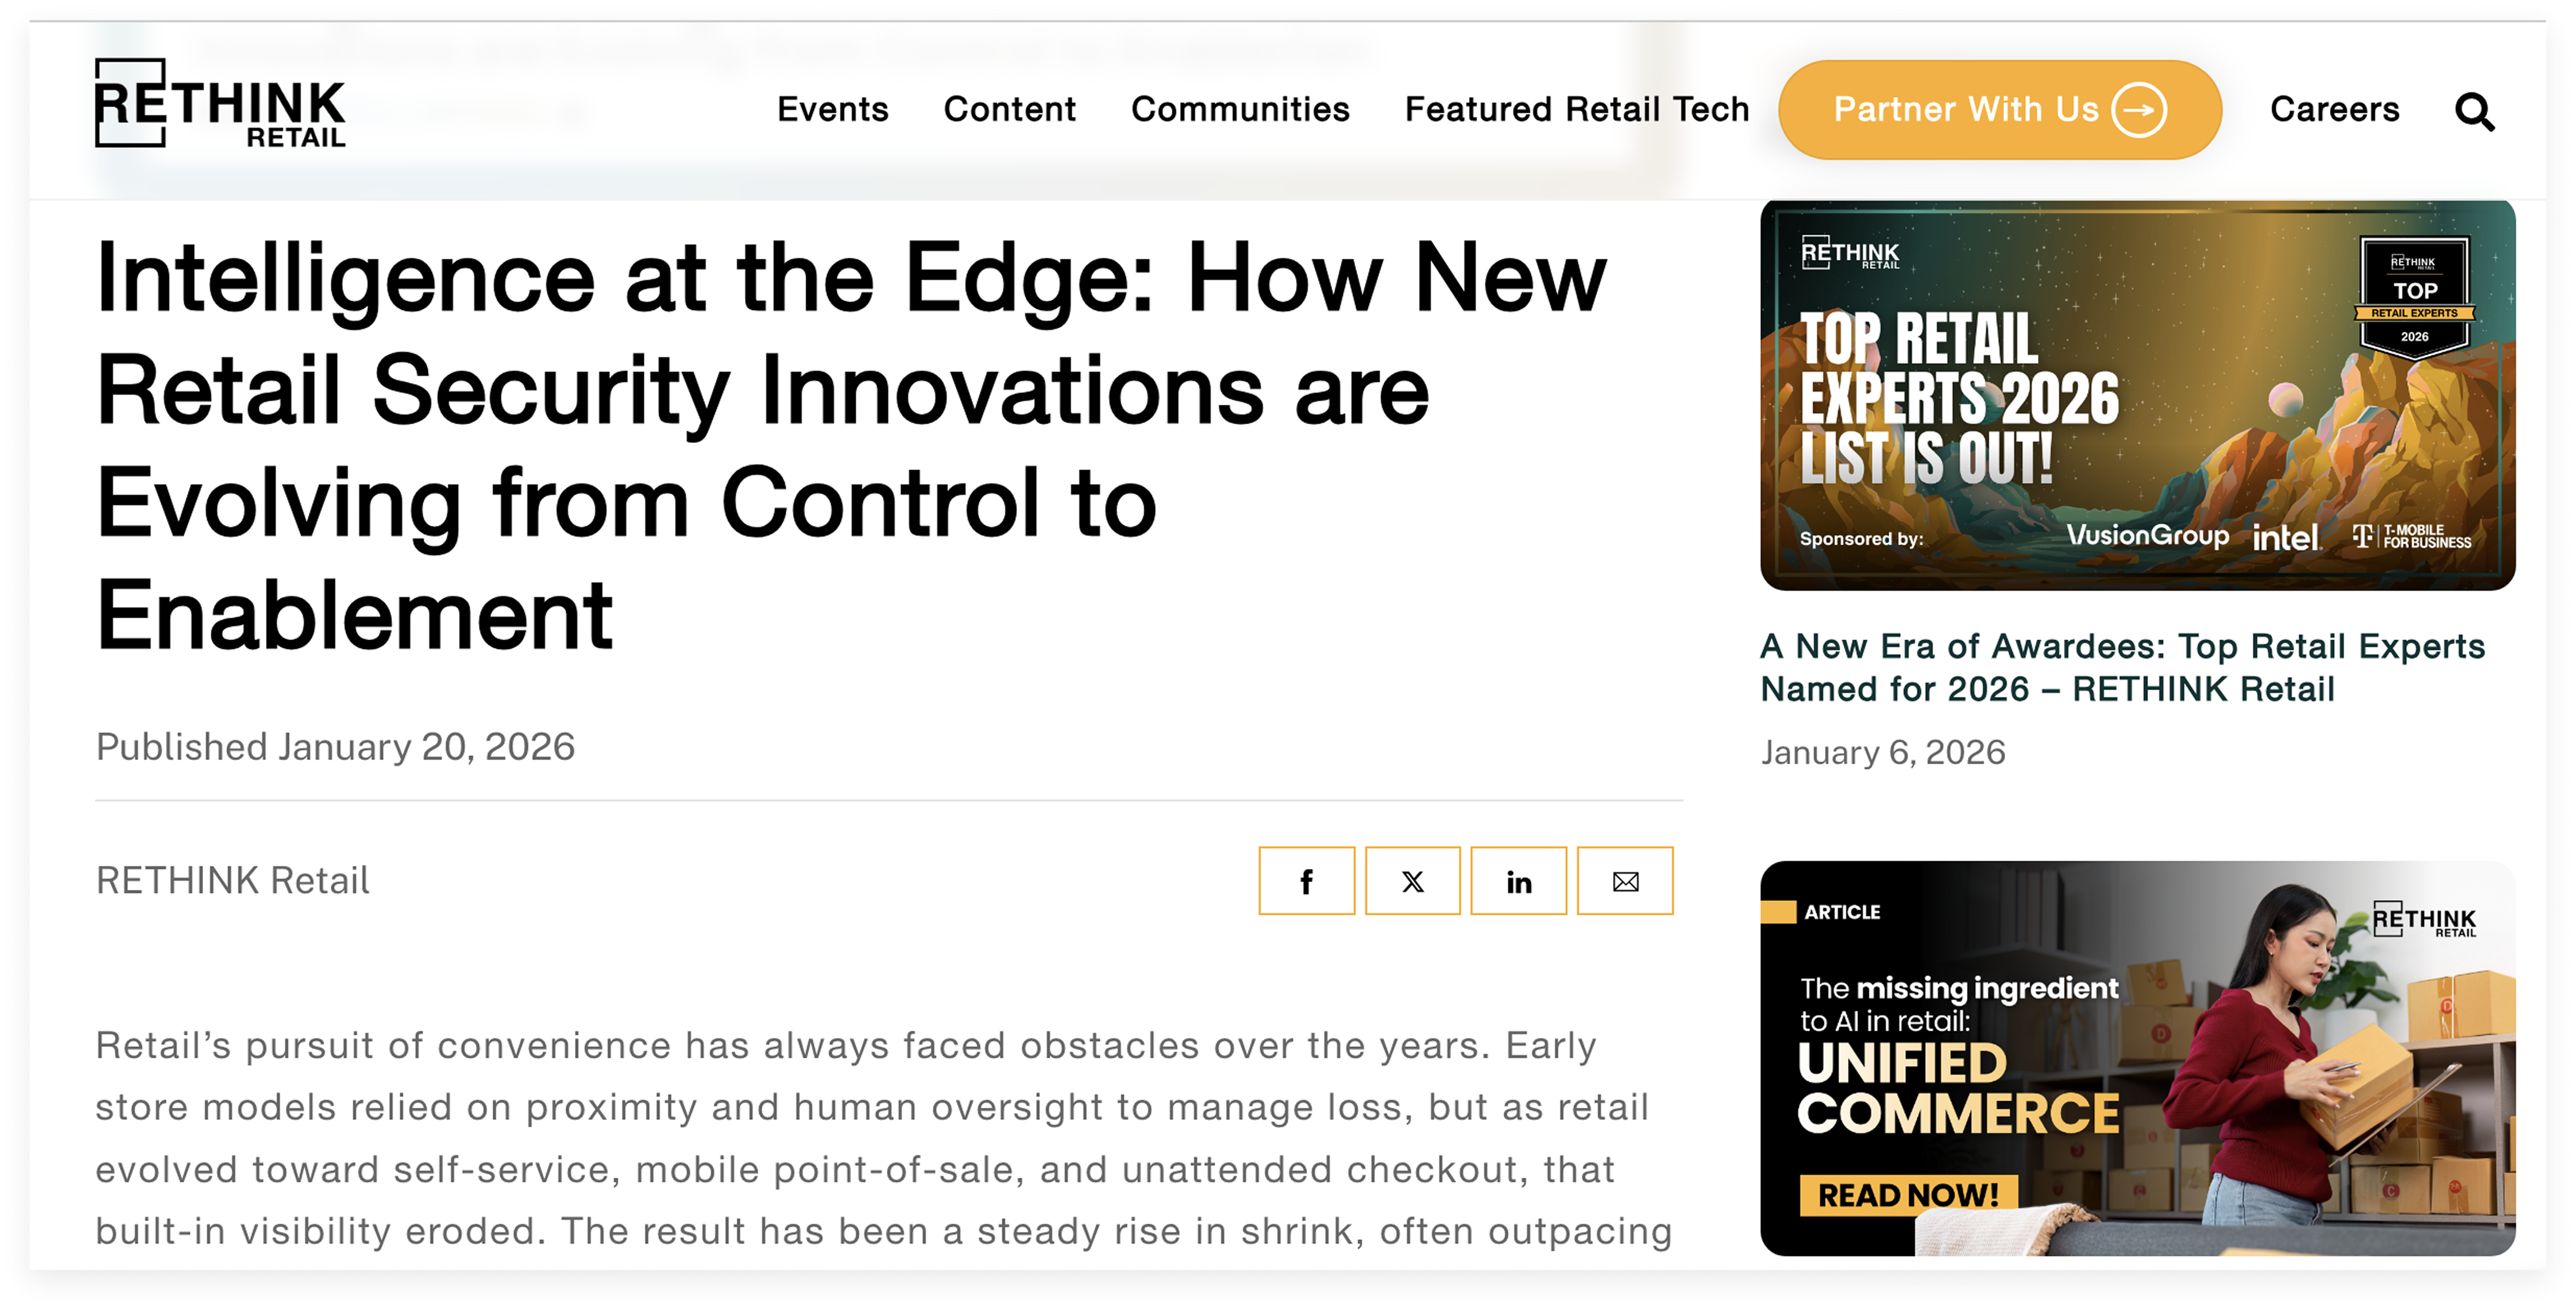
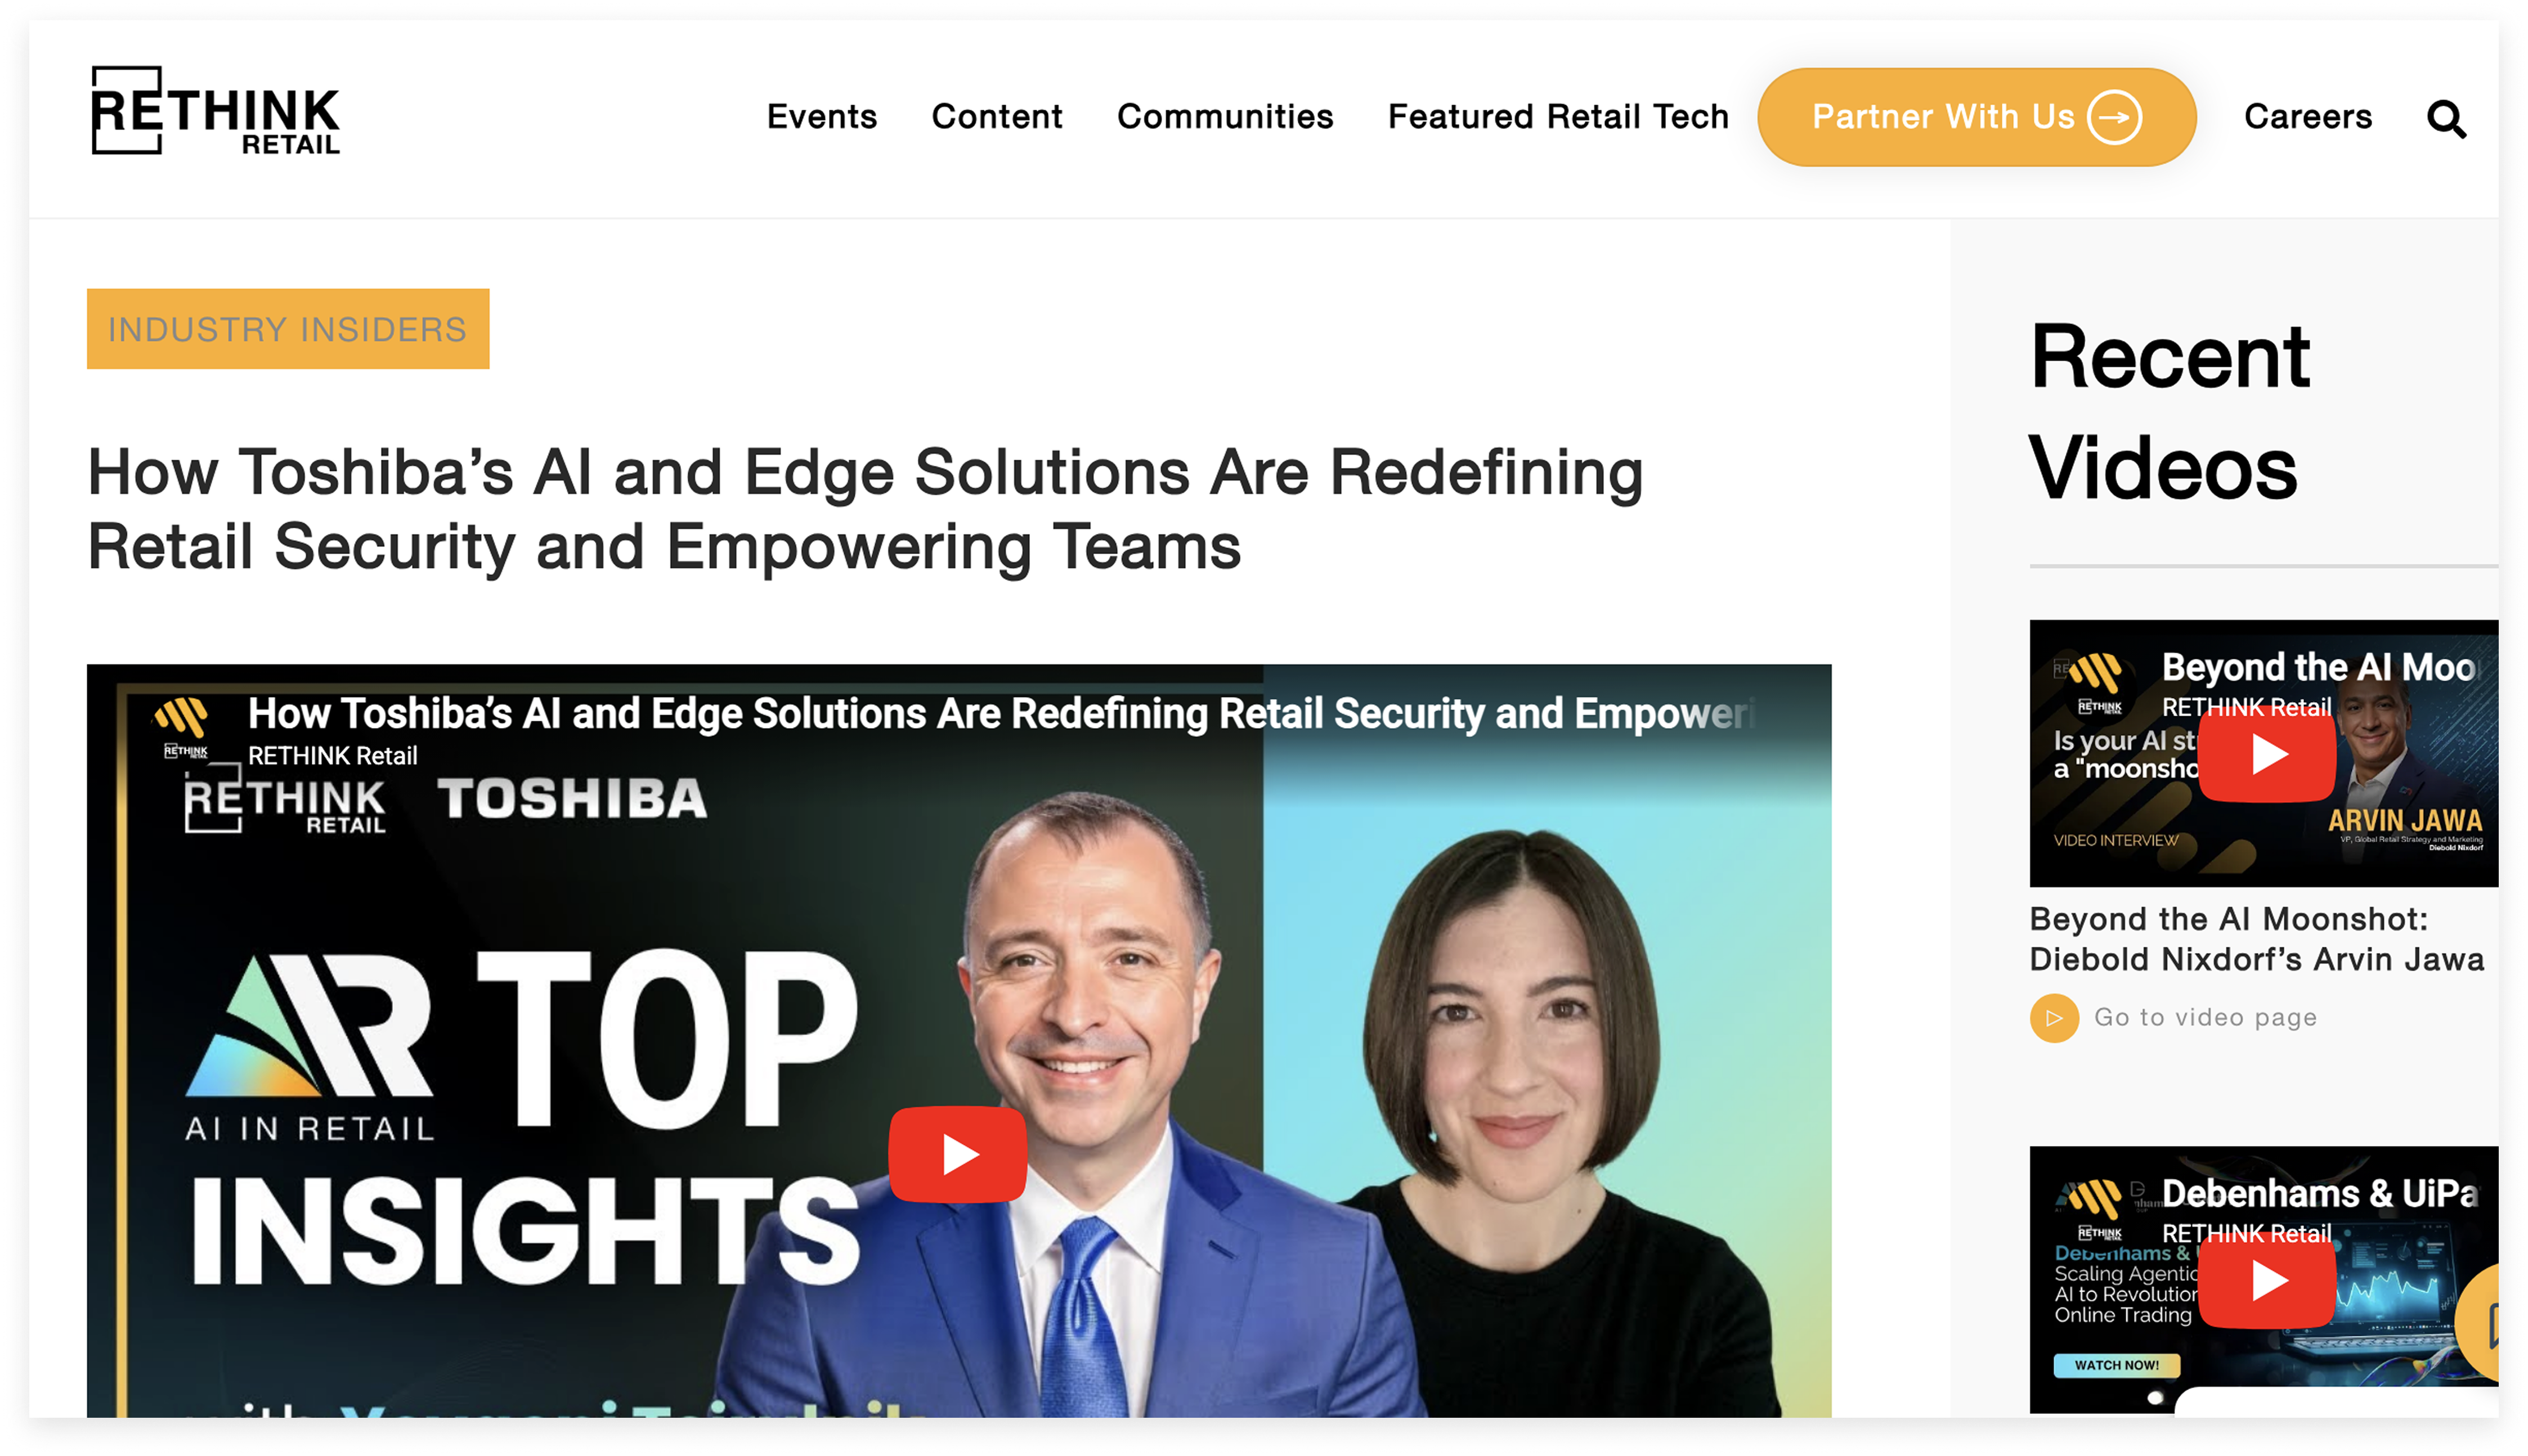
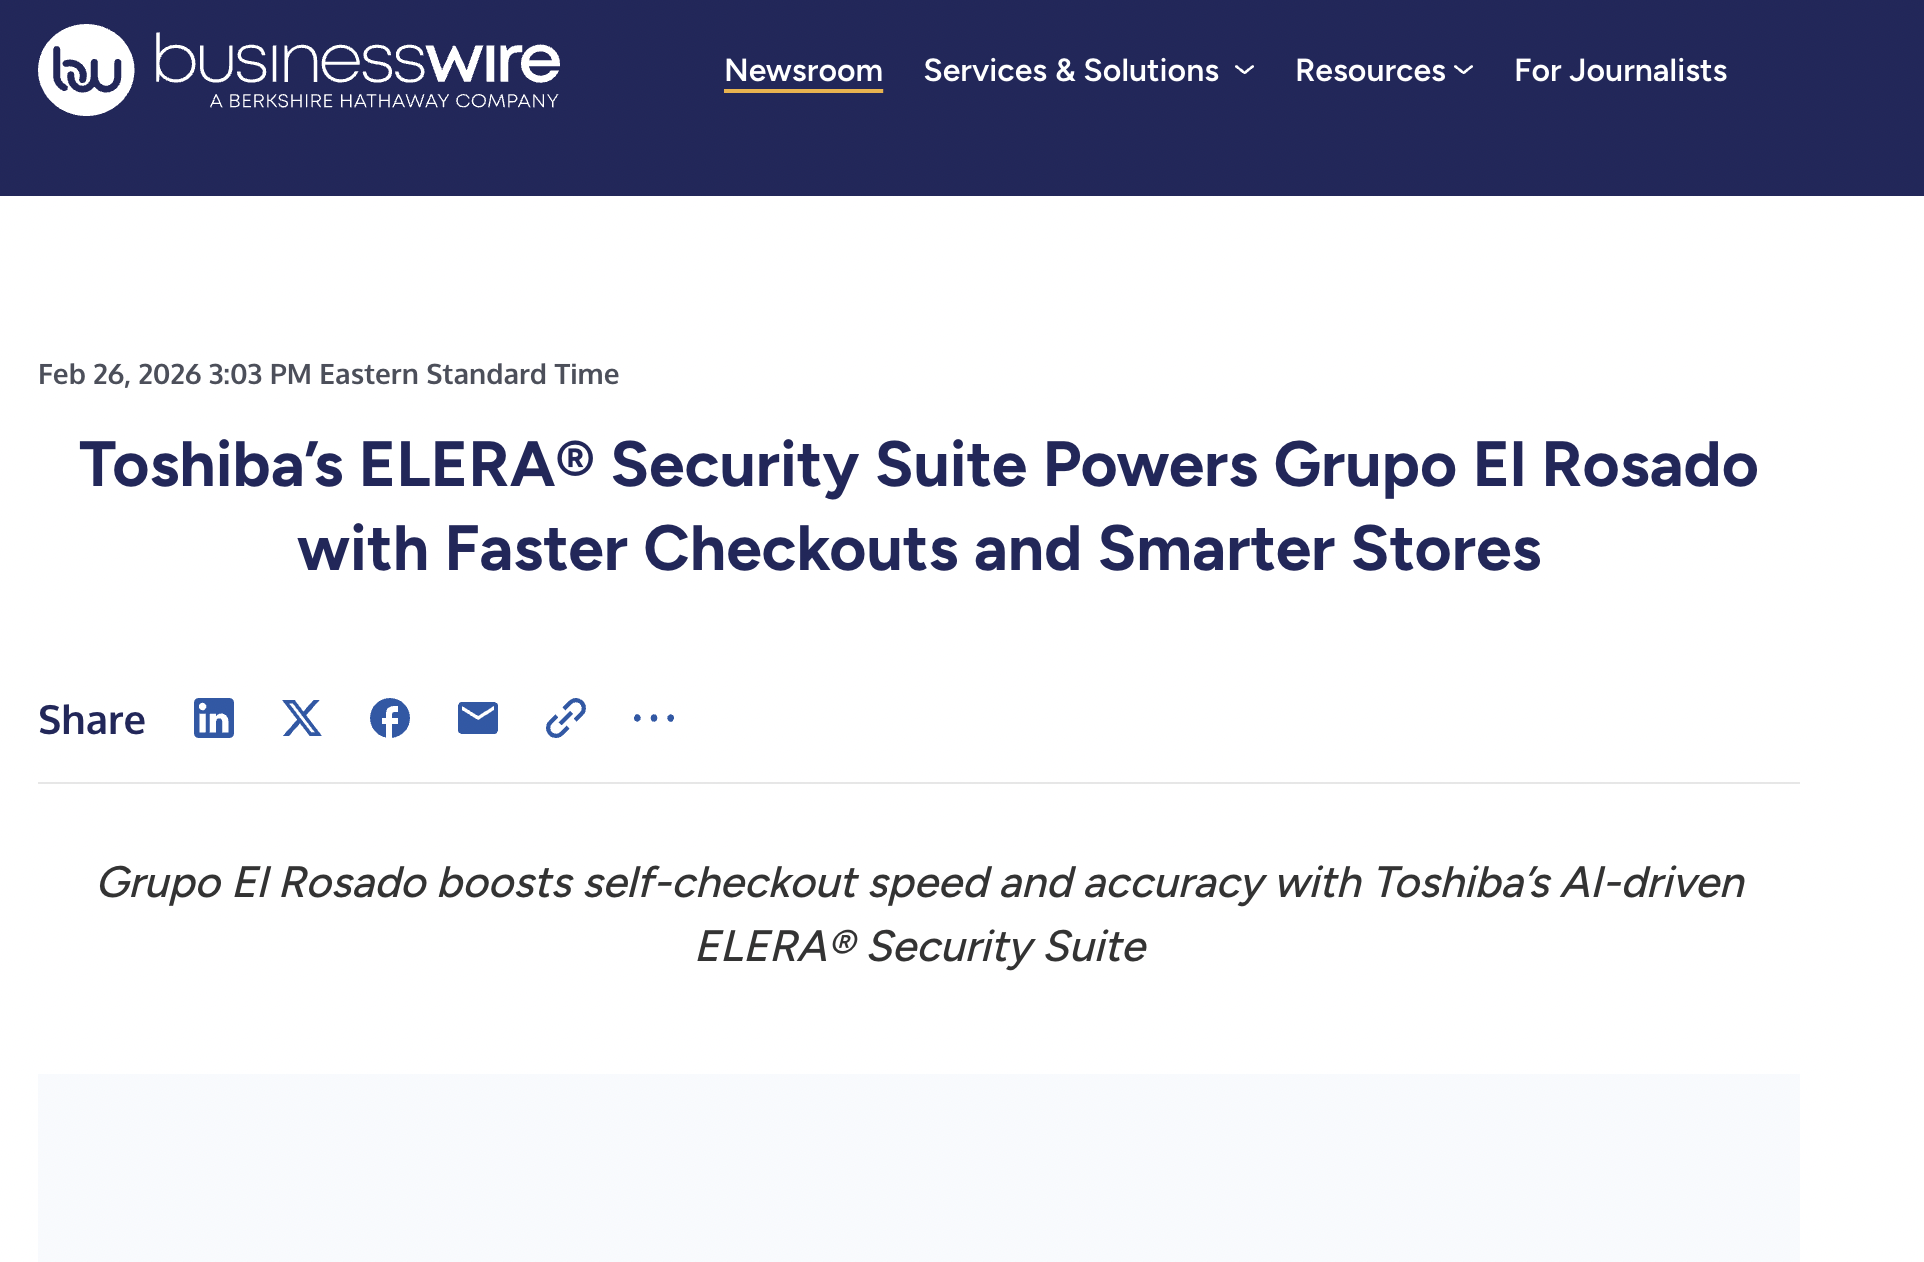
Chains like Olímpica S.A, Weis Markets & Grupo El RosadoMedia Coverage
Got Recognized
Featered in articles for retail security50%-70%
Self-Checkout Growth
Increase in self-checkout transactionsDISCOVERY
Understanding Hardware and Data Flow
It was important to start by understanding self-checkout kiosk hardware and how its sensor data can be used to design a Security Suite dashboard to monitor events over time and enable action to prevent store losses.
Data flow
Understanding Stakeholders
I worked with cross-functional stakeholders and users to map critical loss prevention tasks, identify bottlenecks in event triage, and define which data charts mattered most for fast, high-confidence decisions.

20 User + 4 stakeholder interview
Understanding Road Map with stake holders
Current Problem
- Not Enough Data: Only high-level loss data is available; no drill-down for action.
- Hardware Limitations: Produce switch loss isn’t captured due to hardware limits.

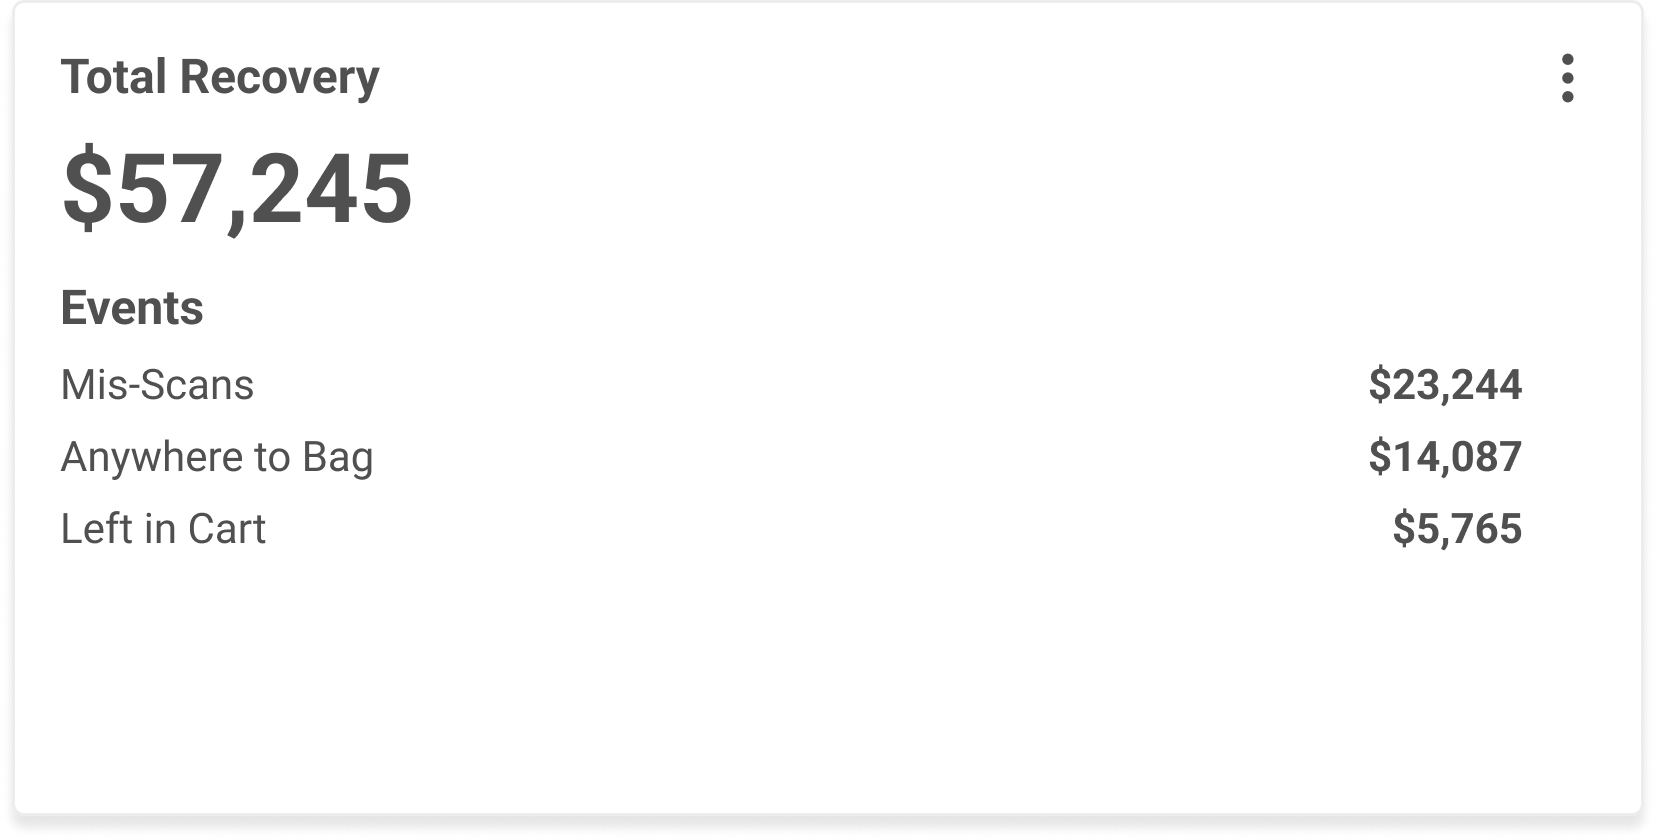
Current Security Suite app view used by Loss Prevention Manager
What Stakeholders Told Us
"We are facing trouble with produce switching, it is not captured in the current app."- LP Manager
"Not enough data is available to track produce switching loss."- PO
"The SS don't help me take action to prevent losses."- LP Manager
DEFINE
Objective
A Security Suite data visualisation dashboard that leverages detailed hardware data to monitor and detect loss in self-checkout without affecting transaction speed.
Persona
This persona was synthesized from user interviews conducted with 20 users.
What are we prioritizing for 1st Version Release?
After creating 49 data charts and tables, I conducted a research session to understand what stakeholders prioritized and which data mattered most for decision-making. In this section, I used a Miro board to organize and rearrange charts based on stakeholder priorities.
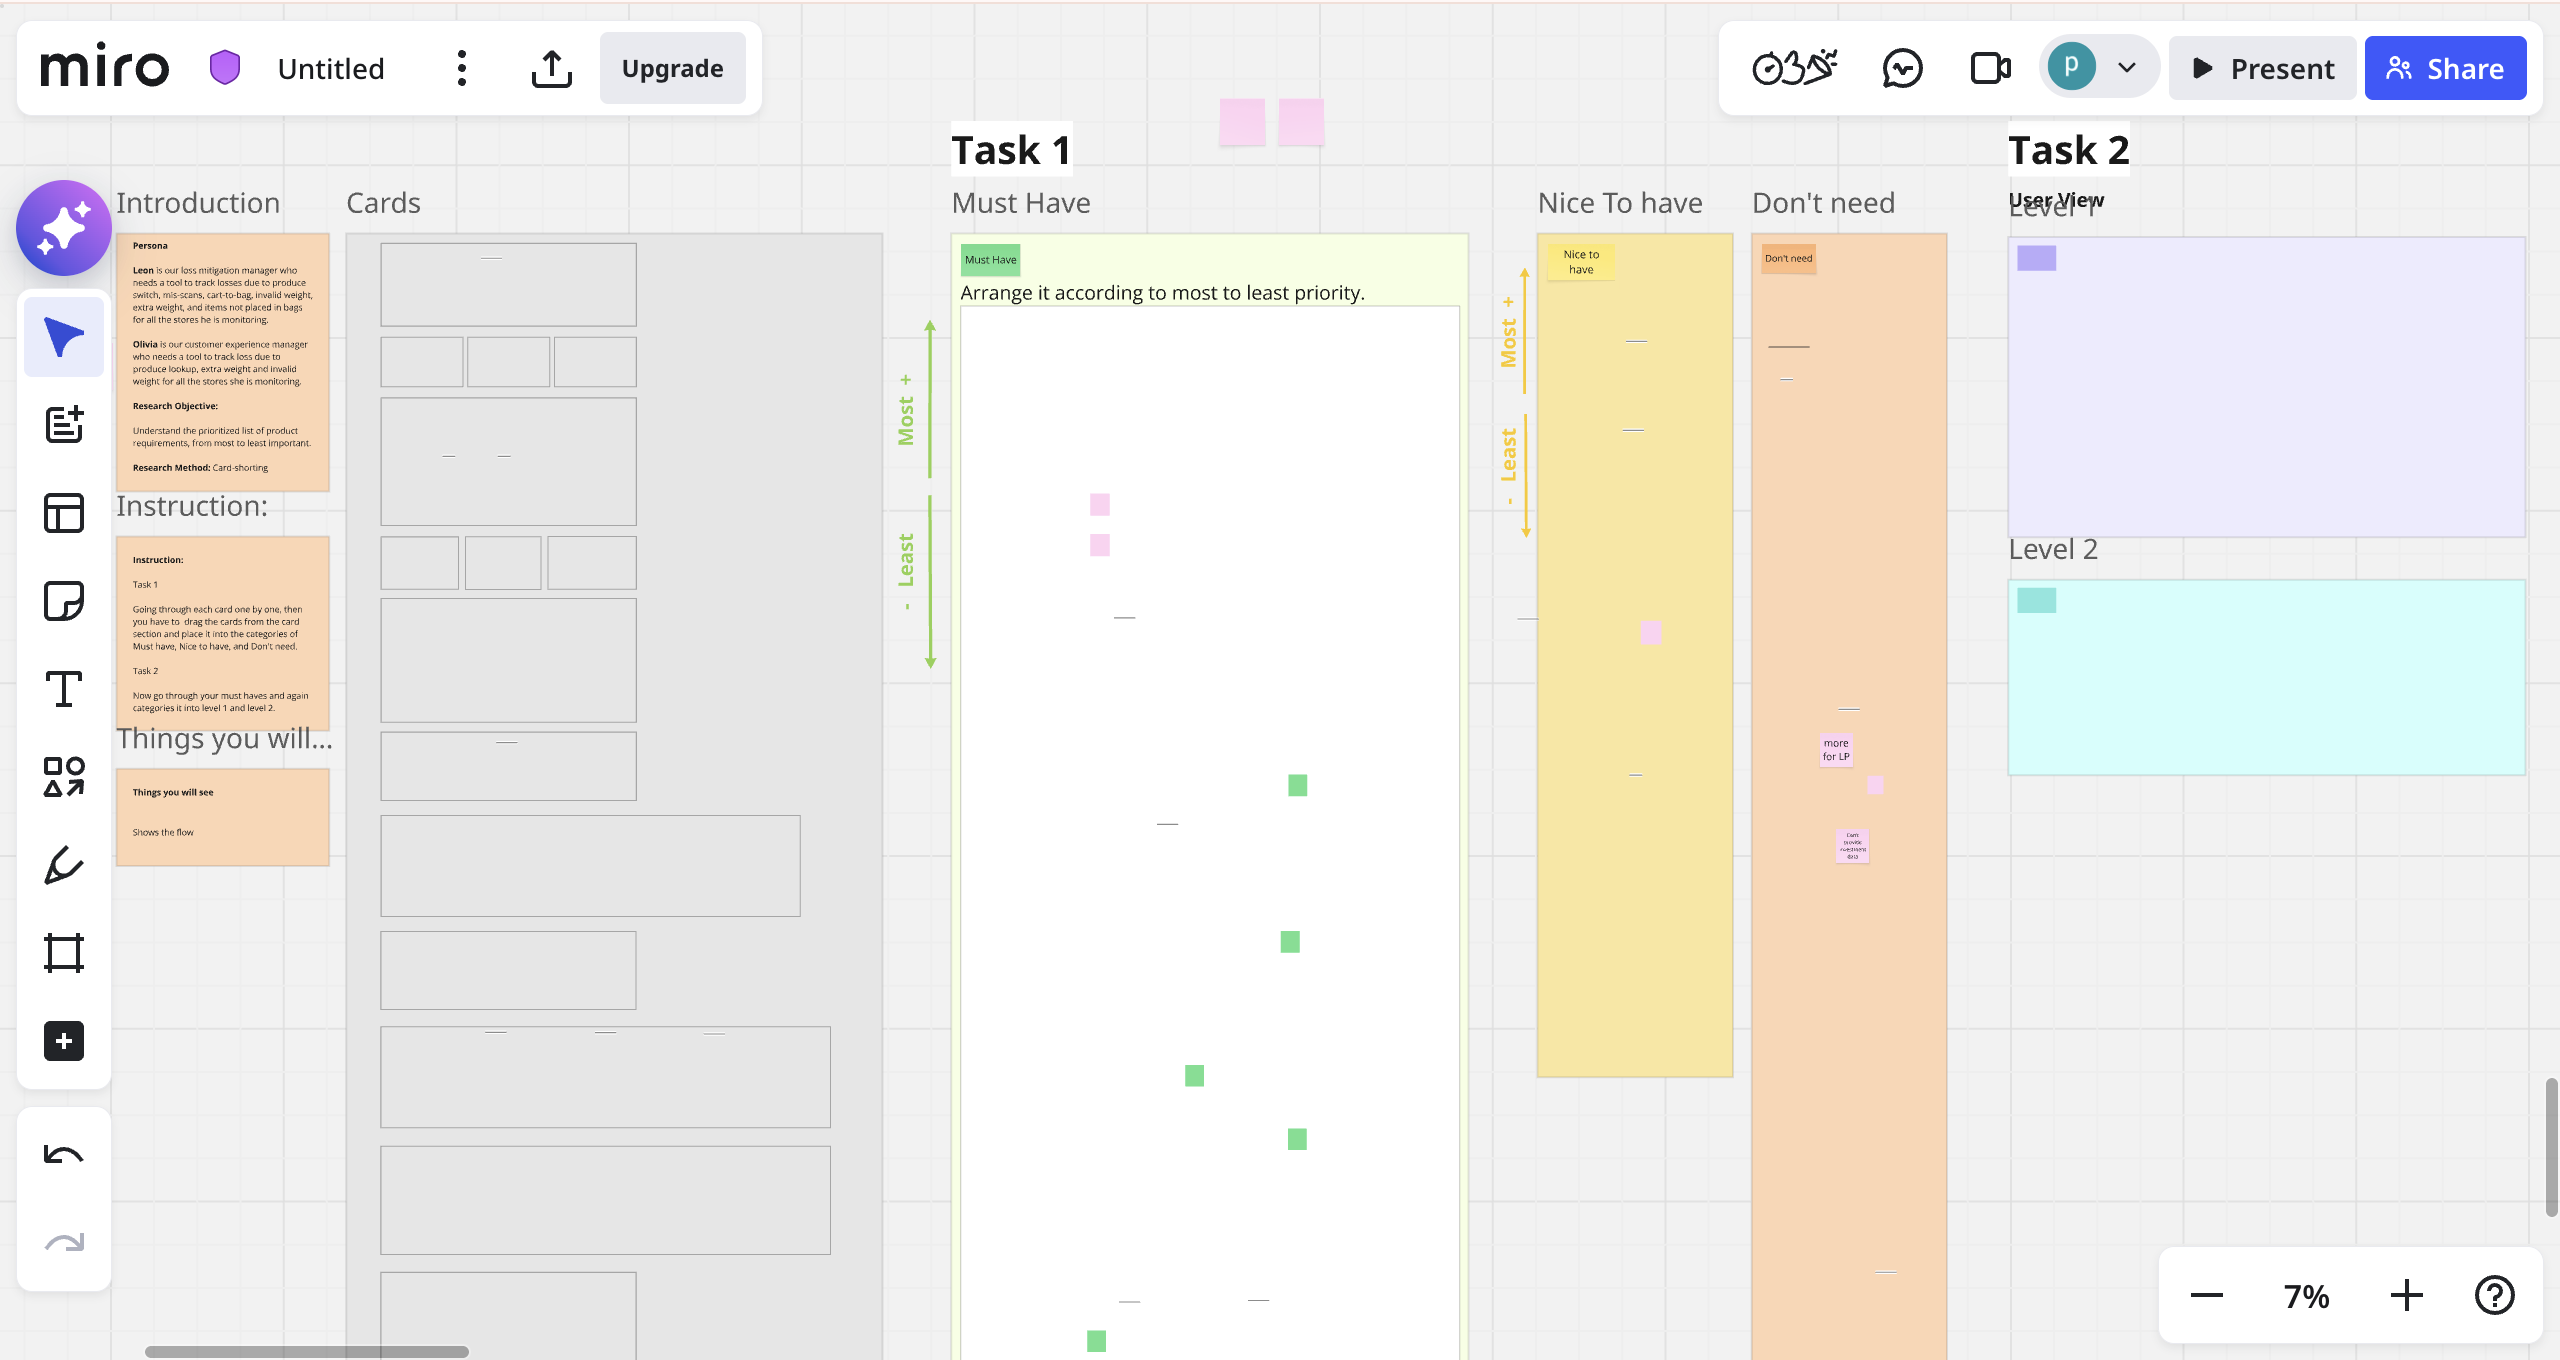
Resrach tool: Miro
Research Finding
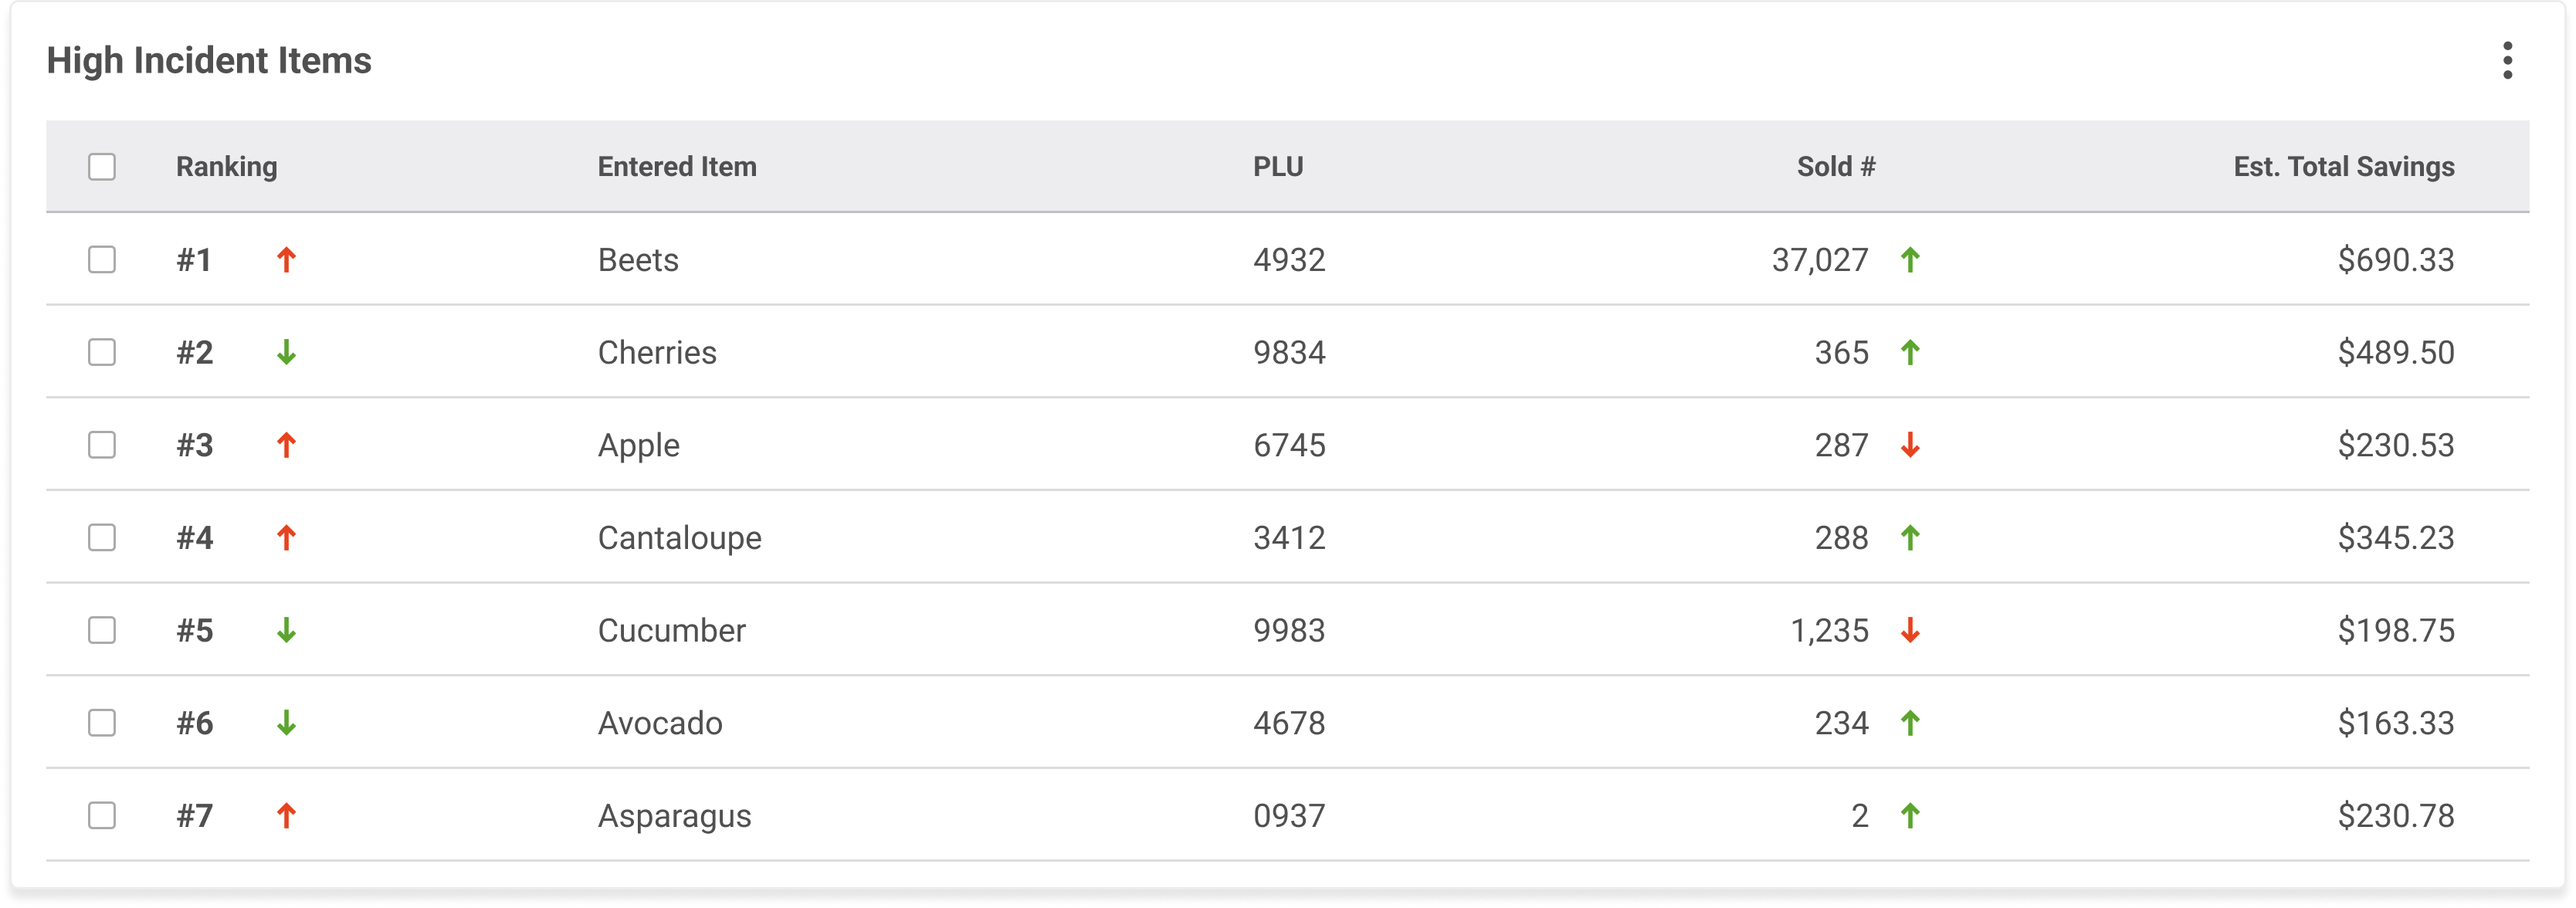
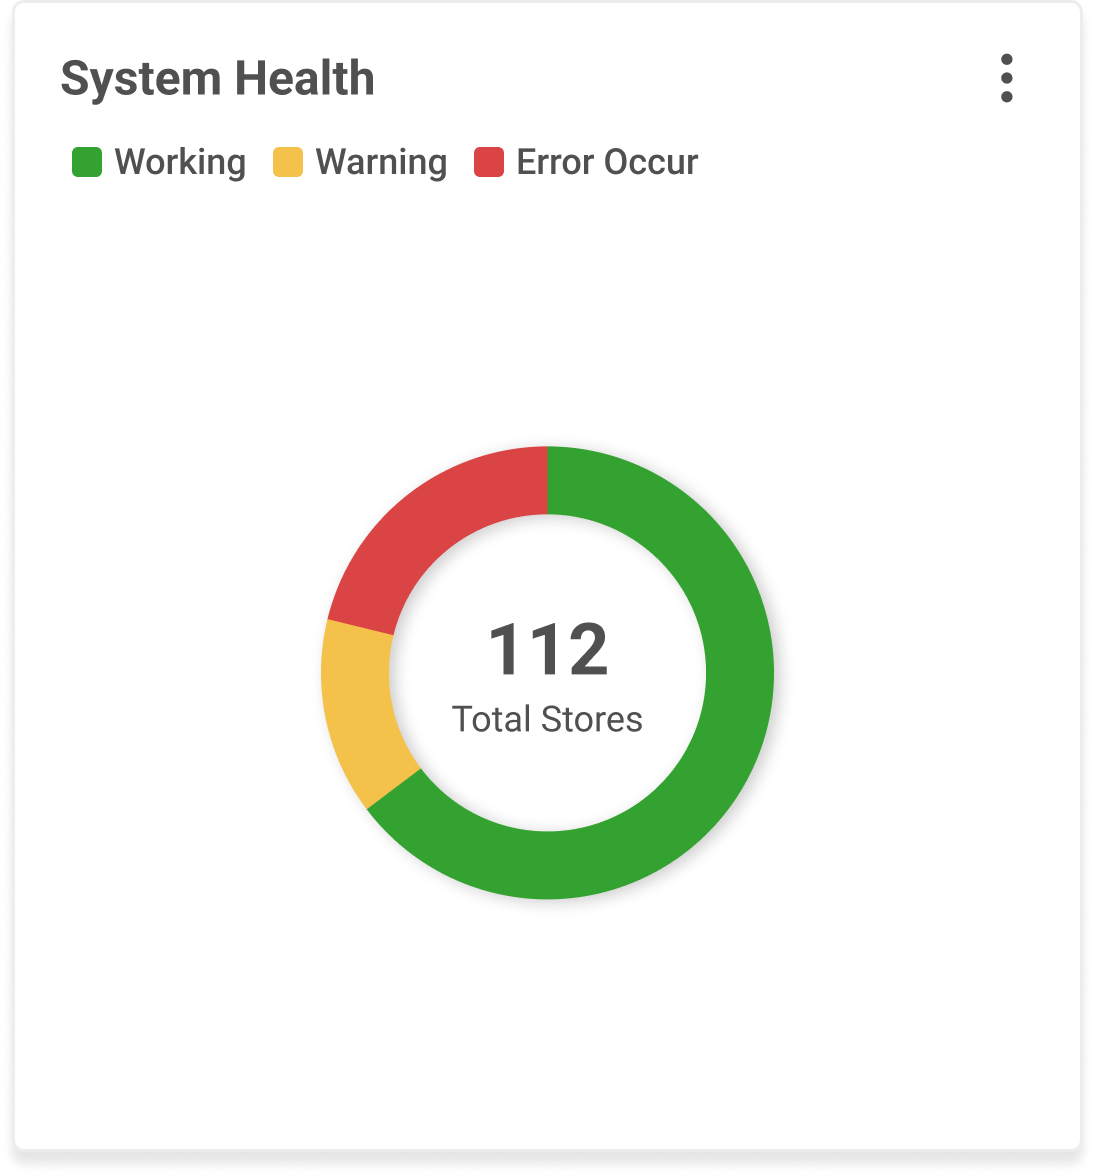
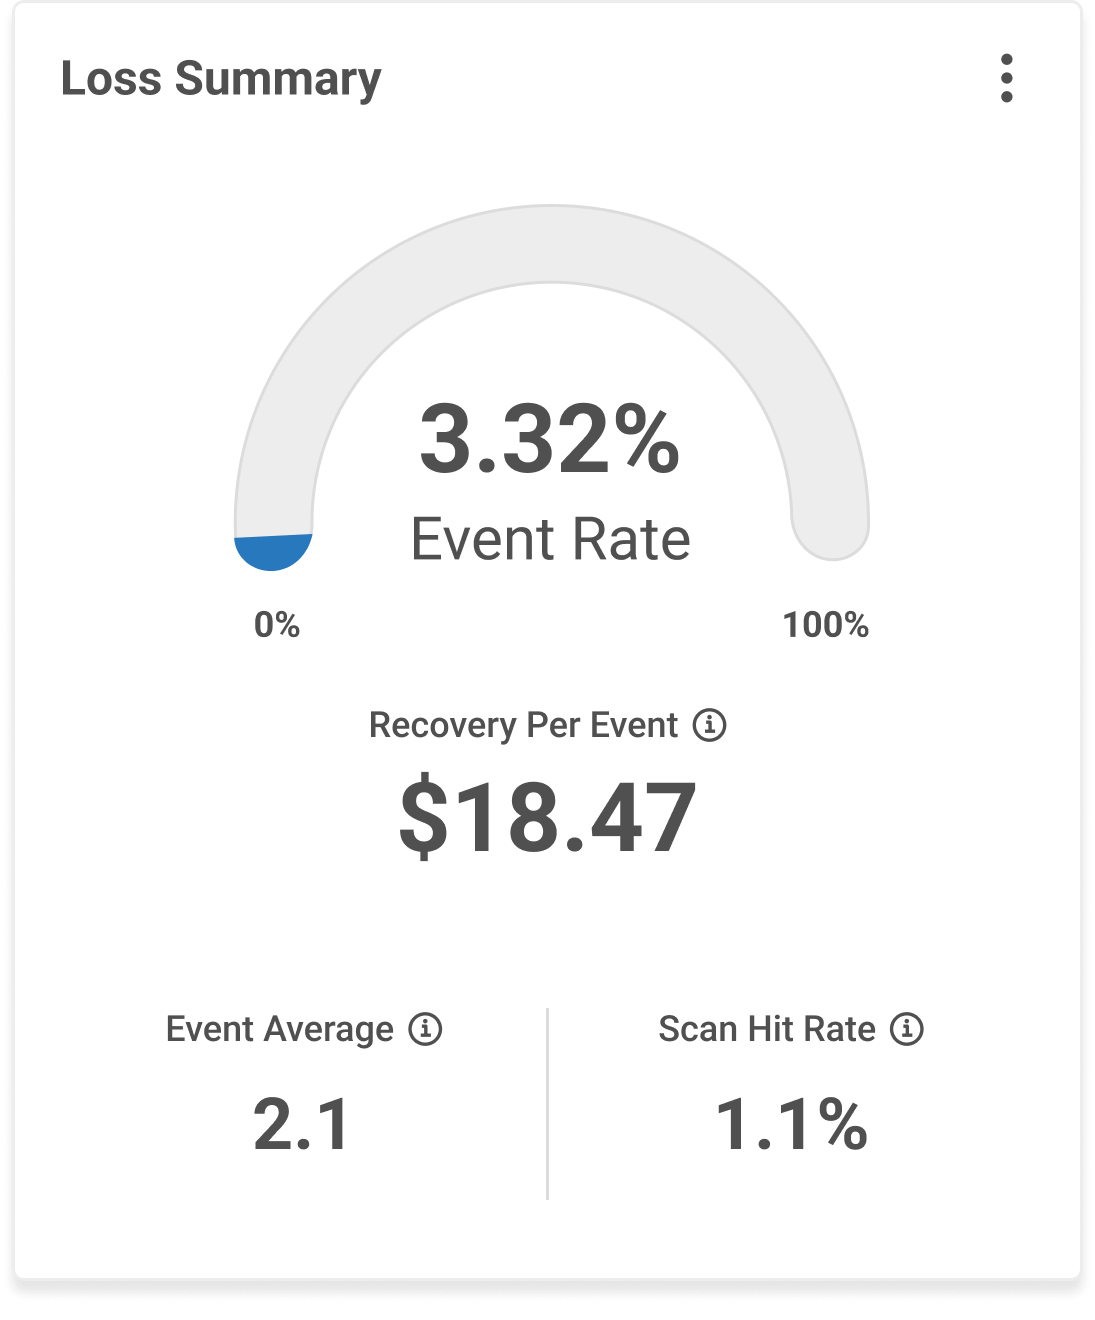
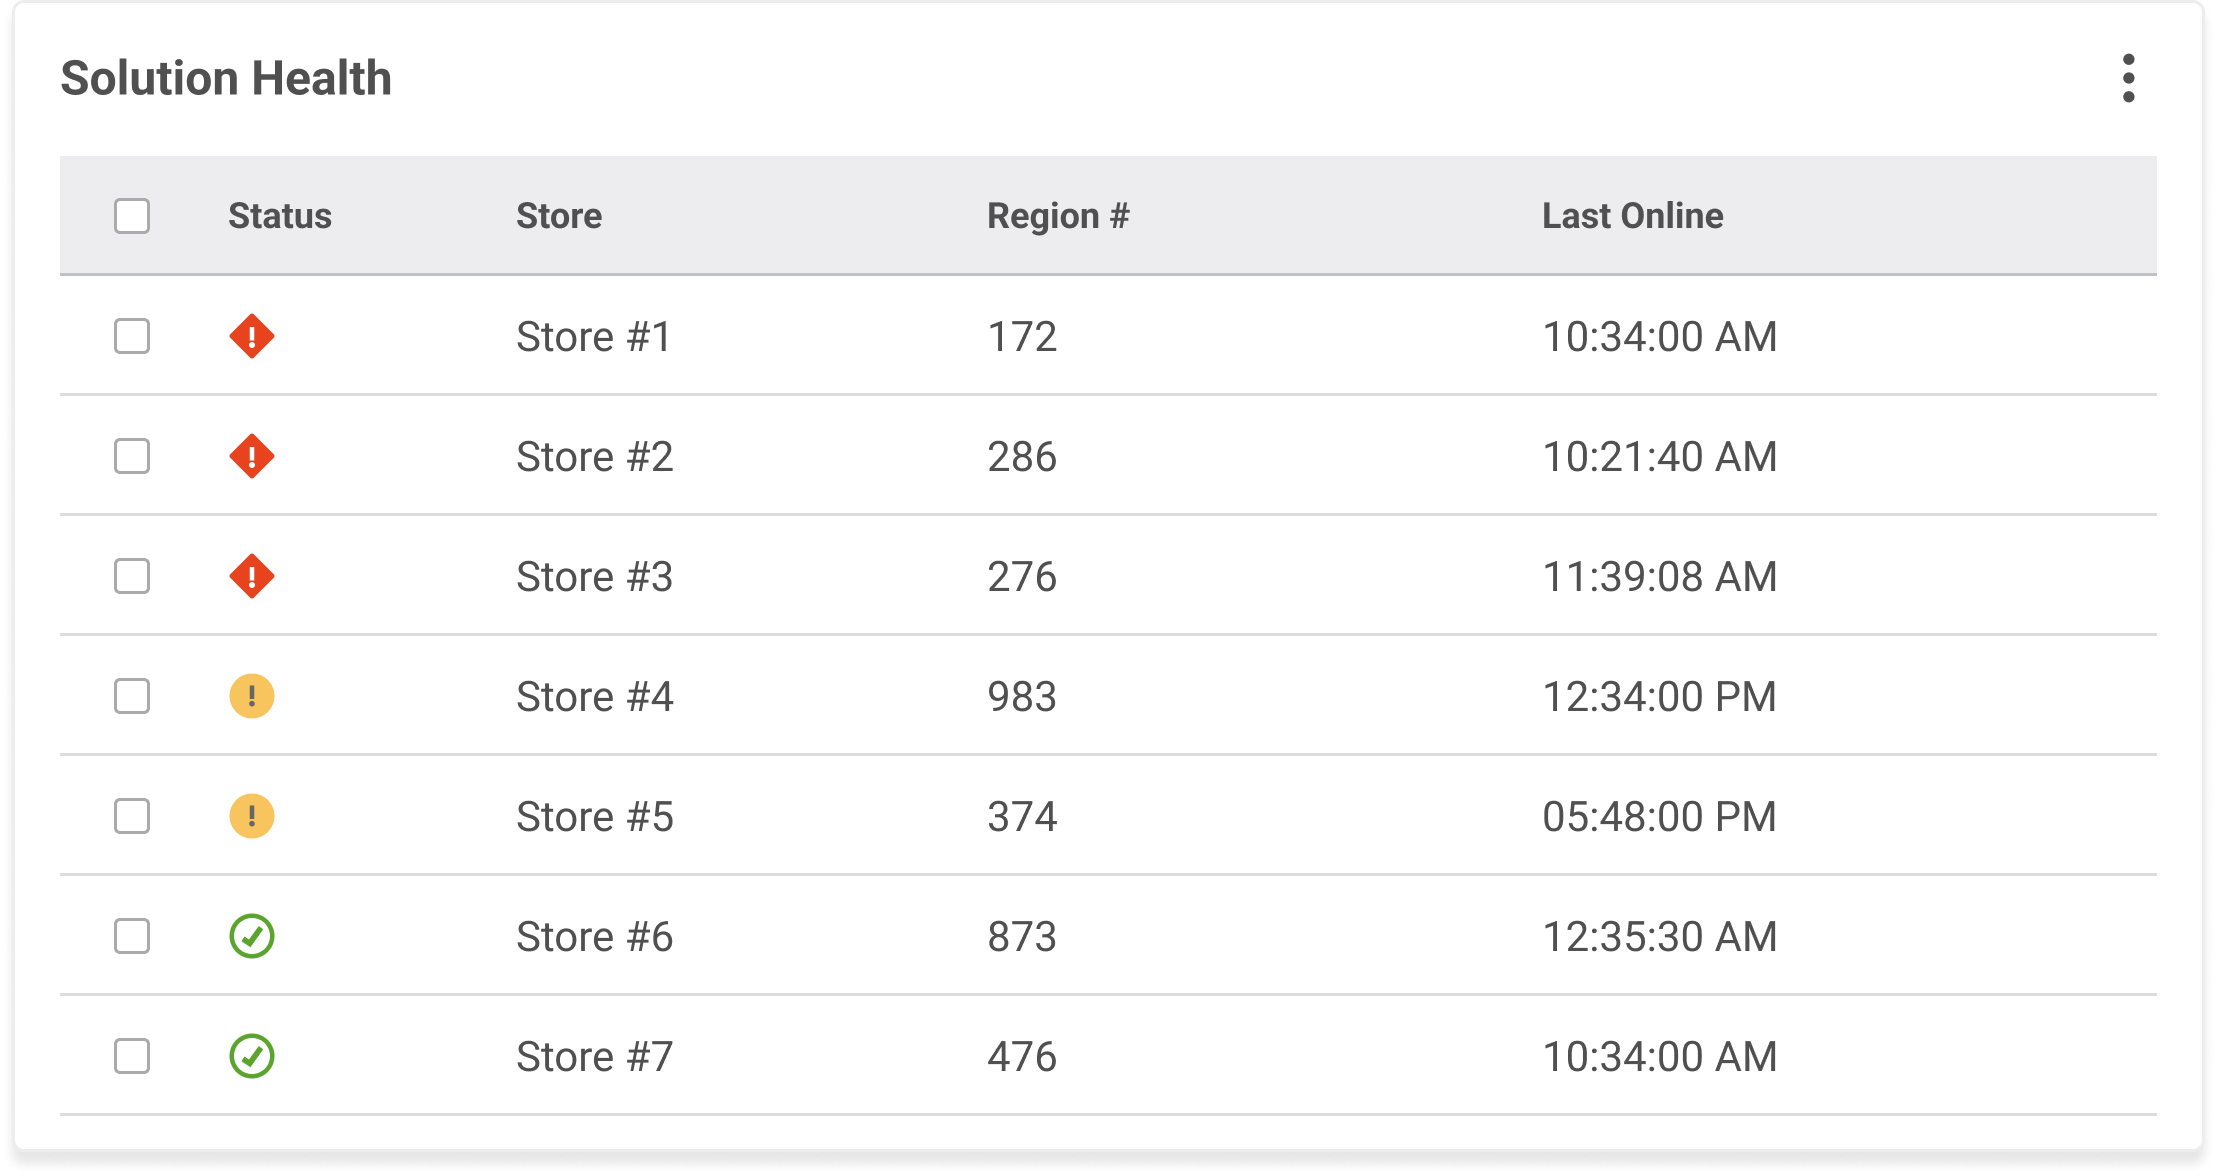
Out of 49 charts+tables only 15 charts+tables made it to the final dashboard.
Interactive prototype
Explore the Security Suite loss-prevention prototype in Figma (desktop width).
RESULTS
Outcome after launch
243 New Locations
Companies across the globe adopted Security Suite workflows.

50%-70%
Increase in self-checkout transactions reported by stores using Security Suite.
Media Coverage
Hover to view all, drag to browse.
Learning outcome
01. Early feedback = clearer, more impactful design.
02. Enabled quick recognition of trends to support timely decision-making.